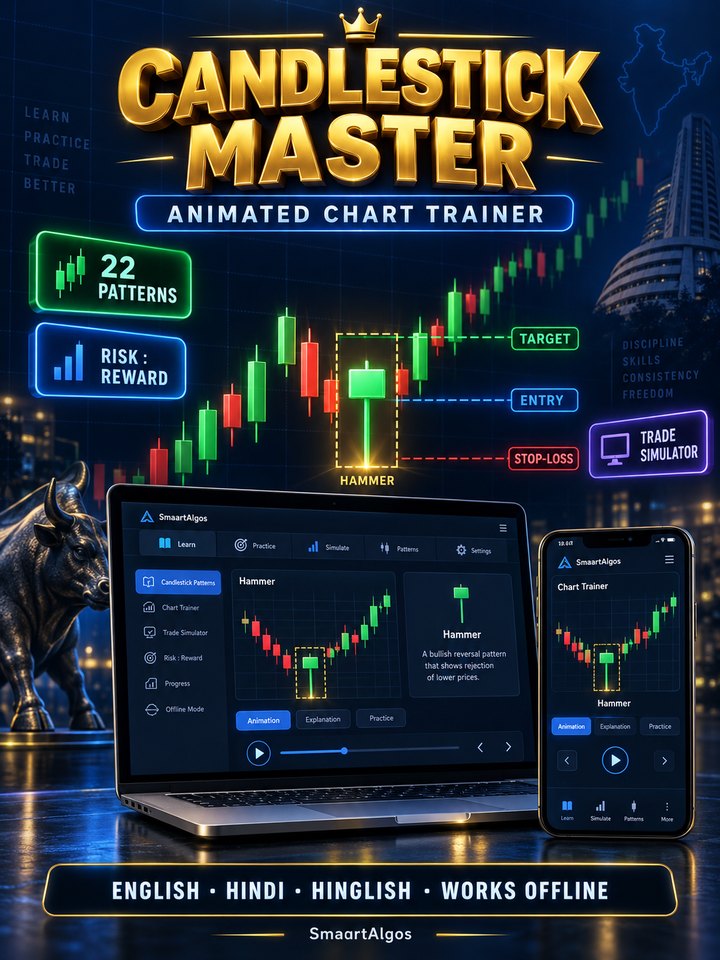
Candlestick Master Animated Chart Trainer
Learn to read candlestick charts by doing — watch candles form, explore 22 animated patterns, plan entry, stop-loss and target, and practise in a simulator.
कैंडलस्टिक मास्टर · 6 interactive modules · English, हिंदी & Hinglish
“Everyone shows you candlestick charts. Almost nobody shows you how a candle is born — or where a sensible entry and stop-loss actually go.”
About Candlestick Master
Candlestick Master is an interactive, animated learning tool that runs in any browser — even offline. Drag Open, High, Low and Close to build a candle and see what each part means, or press play to watch a candle form price by price. Explore 22 of the most-used candlestick patterns (10 single, 8 double, 4 triple), each animated in its trend context with the psychology behind it, where it works, and an example trade plan with entry, stop-loss, target and risk:reward. A 7-step walkthrough shows how to read a chart: trend, support, pattern, confirmation, entry, stop-loss and target. The Entry · SL · Target planner lets you drag lines on a chart to see risk per share, R:R, break-even win rate and position size for your capital. Finish with a pattern-spotting quiz and a trade simulator that teaches why risk management matters more than any single pattern. All charts are simulated for learning — no live data, no tips.
What is inside
- 6 interactive modules · English, हिंदी & Hinglish
- Live candle builder + 'watch a candle form' animation
- 22 animated patterns: 10 single · 8 double · 4 triple
- Psychology, context & example trade plan for each pattern
- 7-step 'How to read a chart' walkthrough
- Drag-the-lines Entry · SL · Target planner with position sizing
- Pattern Spotter quiz & Trade Simulator (R-multiples)
- Windows desktop app (.exe) + HTML version for Mac & mobile
- Works fully offline on laptop & mobile
Candlestick charts look like random red and green bars.
Beginners memorise pattern names from videos, then enter trades without context, place stop-losses randomly and risk too much on one trade.
Learn by touching, watching and practising.
Build candles yourself, watch patterns animate in context, and drag entry, stop-loss and target lines to see the real risk before you ever place an order.
Inside Candlestick Master
- Candle Anatomy — Drag Open/High/Low/Close sliders and watch a candle form price by price — understand body, wicks and who won.
- Pattern Library — 22 animated patterns with trend context, psychology, where they work and an example entry / SL / target.
- How to Read a Chart — A 7-step animated walkthrough: trend → support → pattern → confirmation → entry → stop-loss → target.
- Entry · SL · Target Planner — Drag three lines on a chart to get R:R, break-even win rate, quantity, max loss and capital used.
- Pattern Spotter — A quick quiz: name the highlighted pattern and learn from each answer.
- Trade Simulator — Buy, sell or skip at a pattern, then watch the outcome — learn how R-multiples and stop-losses decide results.
Who is it for?
- Absolute beginners — Never understood a candlestick chart? Start here.
- New traders — Learn where entries and stop-losses make sense before risking money.
- Students — A visual, hands-on way to learn technical analysis basics.
- Trainers — Use it live in workshops — everything is animated and interactive.
How it works
- Try the free demo — Candle Anatomy, 6 patterns and a short quiz — right in your browser.
- Pay ₹149 — UPI, USDT or bank transfer — price shown in your currency.
- Share the receipt — Send your payment screenshot / transaction ID on WhatsApp.
- Download & use — Windows: double-click Candlestick-Master.exe. Mac/mobile: open the HTML file in Chrome or Safari — offline, forever.
What's included
- All 6 modules in one offline file
- 22 animated candlestick patterns
- Entry · SL · Target planner
- Pattern quiz & trade simulator
- English, हिंदी & Hinglish
- Windows .exe app + HTML version
- Easy “How to use” guide
Pricing
| Plan | Price | Details |
|---|---|---|
| Full Tool (6 Modules) | ₹149 | One-time · use offline forever |